Building With Confidence With Replay and Debugging Tools
Sui’s replay tool and debugger give developers the power to retrace transactions and uncover issues with clarity.

Building in Web3 isn’t inherently more complex than working in traditional environments. What makes it challenging is the lack of tooling built for blockchain’s unique characteristics. Transactions are immutable, may include both native commands and smart contract calls, and execute against a precise snapshot of the blockchain’s state at a single moment in time.
When something goes wrong, developers can see the final effects of a transaction on chain, but the internal steps that produced those outcomes are obscure. Unlike in traditional systems, you can’t simply re-run the same code under the same conditions to retrace what happened. The result is an environment where diagnosing issues is often slow and uncertain.
The replay tool and debugger bridge that gap. Together, they make it possible to reconstruct past transactions locally, step through them line by line, and uncover not just what happened, but why.
This gives developers the confidence to diagnose issues more quickly and deliver better, more reliable applications. And for everyday users, that means smoother, safer experiences when interacting with the Sui ecosystem.
The replay tool
The replay tool makes it possible to take any past transaction and reproduce it locally. This gives developers a controlled environment to investigate behavior, whether they are validating assumptions, inspecting object changes, or diagnosing unexpected outcomes.
The tool can be run in two modes. In its standard mode, it provides high-level information such as state changes, gas costs, and storage rebates. With tracing enabled, it goes further, capturing each step of execution, including native Sui commands and individual Move instructions. To support this, the tool automatically downloads and disassembles relevant bytecode, generating a human-readable representation that can be matched with execution steps in the debugger.
Importantly, the replay tool works across all historical transactions, meaning developers can use it with confidence on any piece of activity recorded on the network.
Mysten Labs DevRel engineer Daniel Leavitt demonstrates how to use the replay tool.
Below you can see sample output from replaying an actual transaction in standard mode:
Transaction Effects
├──────────────────────────────────────────────
 Digest: 5sbk5UYpQv1i84zkSBSWmowAmPTxw71U7Bb1gbiW5w4y
 Status: Success
 Executed Epoch: 816

 Mutated Objects:
┌──
 ID:0x03ff4587a65631bb43648a204588789e95c556eb3f577a0bbca49f0c70724fb6
 Owner: Account Address (
   0xdae936b5ac98927cf44e9270dd3a045d04d17dd167f744e619d3ba79207f7068)
 Version: 524747425
 Digest: 5a6zqDPxZi1iPYE4QCGGd9D2WN9fMzZGgAq4LQvYDKsH
└──
┌──
 ID: 0x1e67adaf36d79a3f9e37dde8a8ea24122d4360b537cbaed29612c06267a5d23b
 Owner: Object ID: (
   0xe83c2da3f26cedac7ced3652dbfae0df591aeb51818d45fb33e91364d551d0cd)
 Version: 524747425
 Digest: 7CXwfqNEnXVHHDuFMxNQvpF7TqSDo65RkMh3byXX3qtW
└──
┌──
 ID: 0x4044f18055b2eafa176865303c1d8aa257d2d750e4a003c24e86e2fab2151d4b
 Owner: Object ID: (
   0xa676f00193c93b812da927baf1e51bd408c2a32b14104df6c1af2b0e874f33ad)
 Version: 524747425
 Digest: B5qvW4VTQXHotjJ9becki57bnD45fcJvWN8gTzWViVN4
└──
┌──
 ID: 0x8ece4cb6de126eb5c7a375f90c221bdc16c81ad8f6f894af08e0b6c25fb50a45
 Owner: Shared( 414117256 )
 Version: 524747425
 Digest: 68jzyz67fHfS3xczermH8FUmDXg82pJ75t8SWLkq5W3G
└──
┌──
 ID: 0xd7aaa813f0ee8b63ea5a1ea85849a74f8d48210358b53d0de710de29566d6247
 Owner: Object ID: (
   0xa30645bc6016097b9182a25eb57a50522a1c08216416b21be8fef564aeb6e0fe )
 Version: 524747425
 Digest: A57sAtSpBT6nmUMqbas5w6Kh6a7guhTgZTxM1JeQavy1
└──

Shared Objects:
┌──
 ID: 0x8ece4cb6de126eb5c7a375f90c221bdc16c81ad8f6f894af08e0b6c25fb50a45
 Version: 524747424
 Digest: AHtPqe2Spt5N1ba5QiBtnkj3yBNTNV27av8FSKgbaS21
└──
Deleted Objects:
┌──
 ID: 0xf2a44b7b1de81c8fbf11635411fa7cd2cdc8ae64b48dae13928d4d91066cf13b
 Version: 524747425
 Digest: 7gyGAp71YXQRoxmFBaHxofQXAipvgHyBKPyxmdSJxyvz
└──
┌──
 ID: 0xfe02a0286e87e702c6c9ccd87c3392033bdaf571aeed2f48982591e8ea5f21f5
 Version: 524747425
 Digest: 7gyGAp71YXQRoxmFBaHxofQXAipvgHyBKPyxmdSJxyvz
└──

Gas Object:
┌──
 ID: 0x03ff4587a65631bb43648a204588789e95c556eb3f577a0bbca49f0c70724fb6
 Owner: Account Address (
   0xdae936b5ac98927cf44e9270dd3a045d04d17dd167f744e619d3ba79207f7068)
 Version: 524747425
 Digest: 5a6zqDPxZi1iPYE4QCGGd9D2WN9fMzZGgAq4LQvYDKsH
└──

Gas Cost Summary:
 Storage Cost: 11187200 MIST
 Computation Cost: 1000000 MIST
 Storage Rebate: 13031568 MIST
 Non-refundable Storage Fee: 131632 MIST

Transaction Dependencies:
 jTwsncjYXYtioZqfTZSpjLUaxWrNT2vyhSgjP3P9XGG
 36GM8UKe7M71qQkSY468vnxcApxFuMErx4M8vF5fQdLs
 4h5punxCyApywJVsWaux7Ym7mf7tzBECjp2avZTaLdue
 BvfZzvfVD8SYPAx6De3CVFrgrxdSVgEACqxtvBtiHm7R
 D3AKQmh6WsSv74cGeXpdE5cg3TdRHcptapPd2ySBQdFX
 D7LMC2Jzf9LH2FmeW4WW2qbHDgEBCfduDhFH3Y2LpQAH


Transaction Gas Report for 5sbk5UYpQv1i84zkSBSWmowAmPTxw71U7Bb1gbiW5w4y
╭────────────────────────────┬──────────╮
│ Gas Info                   │          │
├────────────────────────────┼──────────┤
│ Computation Cost           │ 1000000  │
│ Storage Cost               │ 11187200 │
│ Storage Rebate             │ 13031568 │
│ Non-Refundable Storage Fee │ 131632   │
│ Gas Used                   │ 947      │
│ Gas Budget                 │ 3089992  │
│ Gas Price                  │ 1000     │
│ Reference Gas Price        │ 1000     │
│ Storage Gas Price          │ 76       │
│ Rebate Rate                │ 9900     │
╰────────────────────────────┴──────────╯

╭───────────────────────────────────────────────────────────────────────╮
│Object ID                                                              │
│  Bytes │ Old Rebate │ New Rebate                                      │
├───────────────────────────────────────────────────────────────────────┤
│0x03ff4587a65631bb43648a204588789e95c556eb3f577a0bbca49f0c70724fb6     │
│  130   │ 988000    │ 988000                                           │
│0x1e67adaf36d79a3f9e37dde8a8ea24122d4360b537cbaed29612c06267a5d23b     │
│  461   │ 3503600   │3503600                                           │
│0x4044f18055b2eafa176865303c1d8aa257d2d750e4a003c24e86e2fab2151d4b     │
│  398   │ 3024800   │ 3024800                                          │
│0x8ece4cb6de126eb5c7a375f90c221bdc16c81ad8f6f894af08e0b6c25fb50a45     │
│  175   │ 1330000   │ 1330000                                          │
│0xd7aaa813f0ee8b63ea5a1ea85849a74f8d48210358b53d0de710de29566d6247     │
│  308   │ 2340800   │ 2340800                                          │
│0xf2a44b7b1de81c8fbf11635411fa7cd2cdc8ae64b48dae13928d4d91066cf13b     │
│  0     │ 988000    │ 0                                                │
│ 0xfe02a0286e87e702c6c9ccd87c3392033bdaf571aeed2f48982591e8ea5f21f5    │
│  0     │ 988000    │ 0                                                │
╰───────────────────────────────────────────────────────────────────────╯
Debugging with confidence
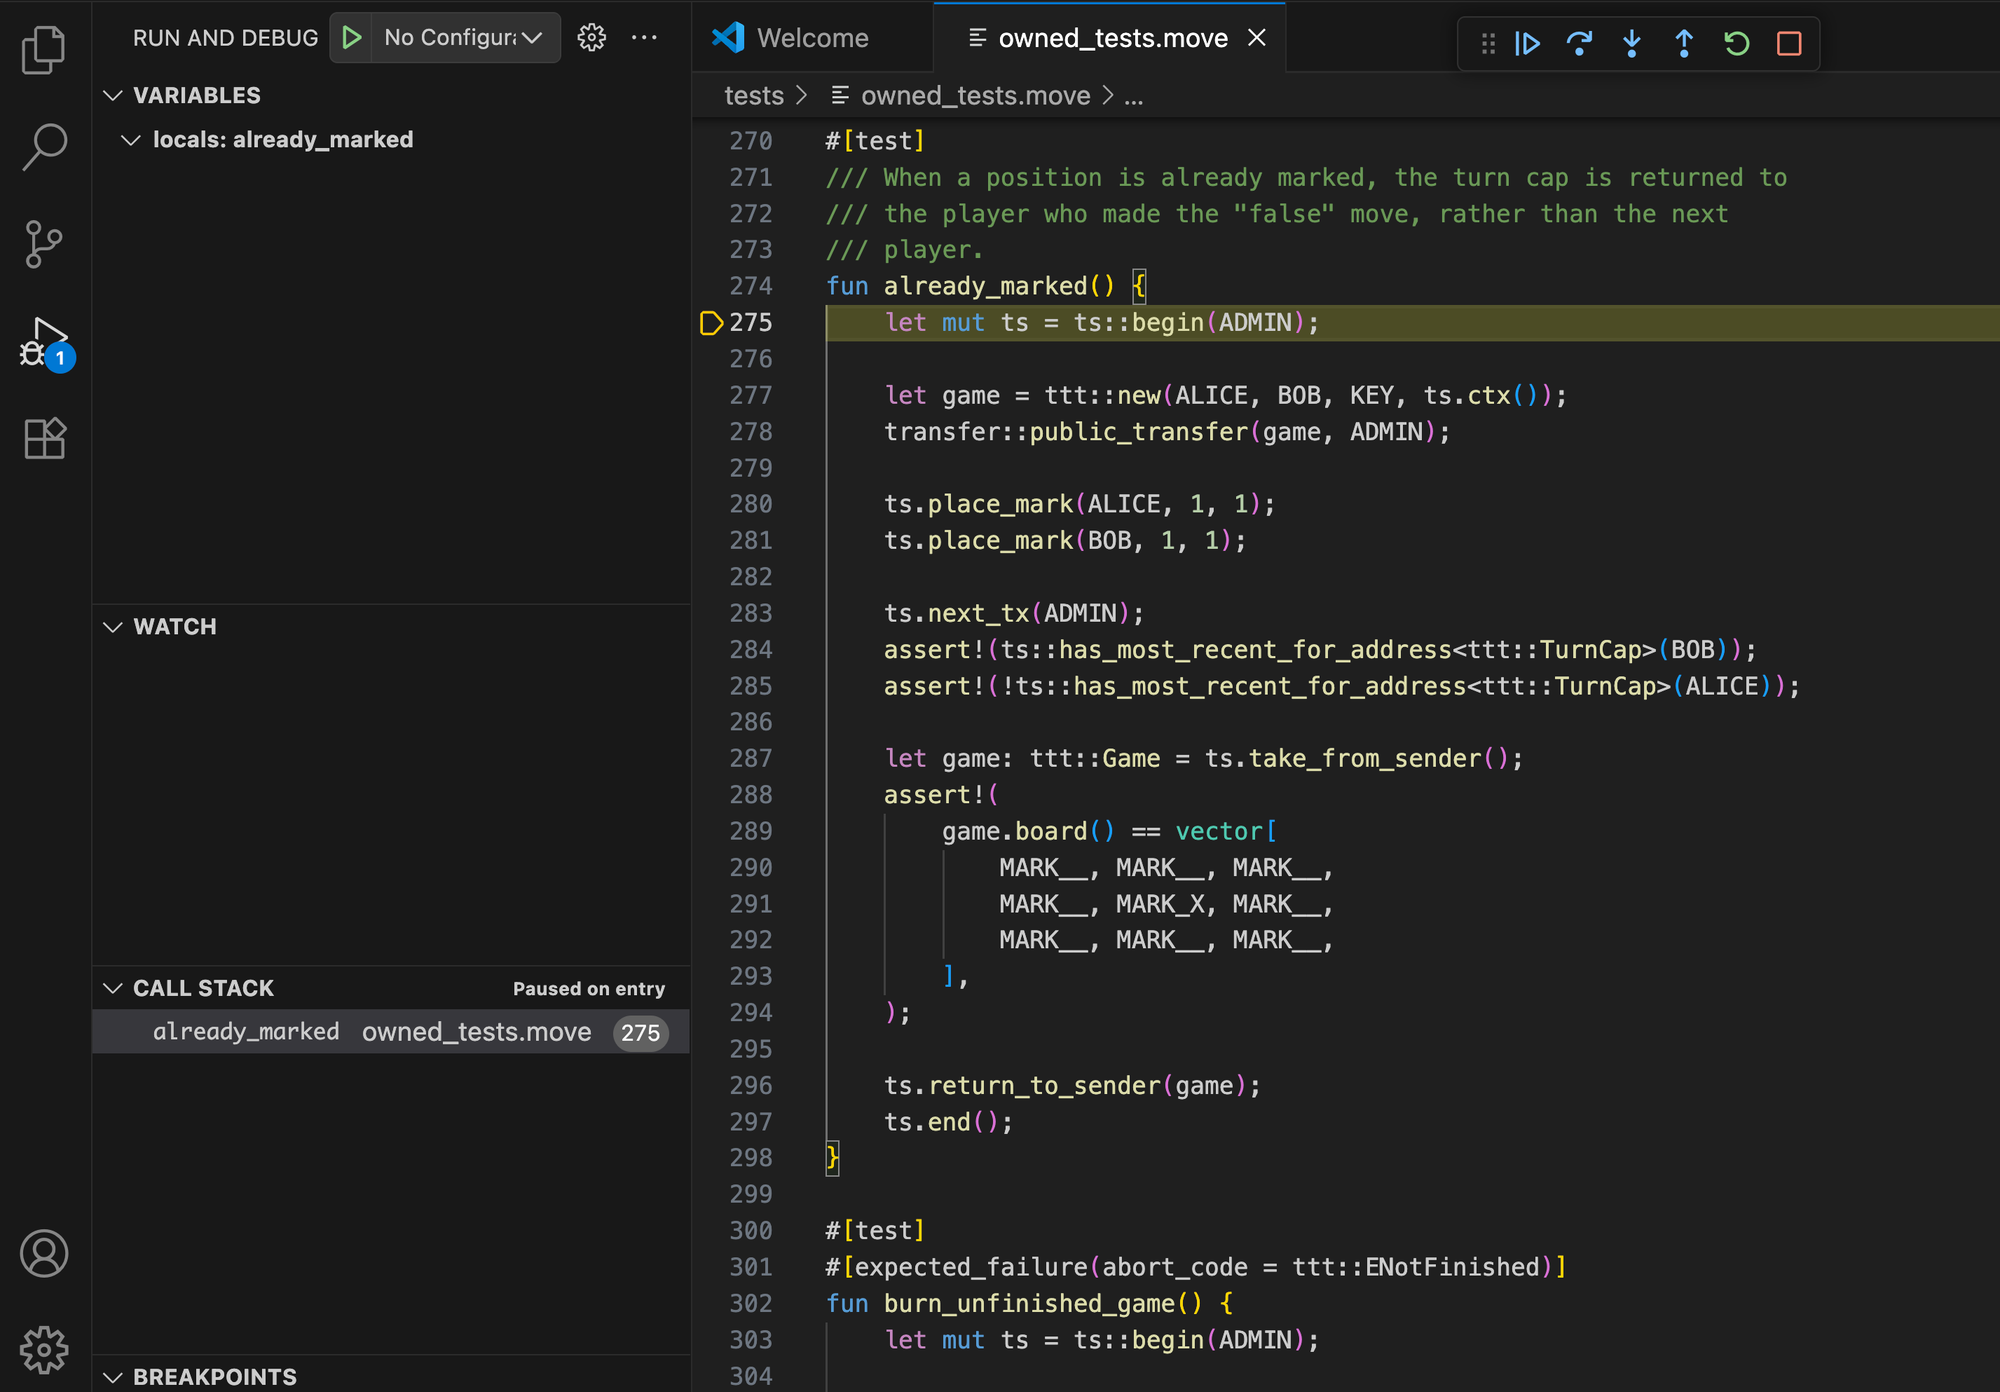
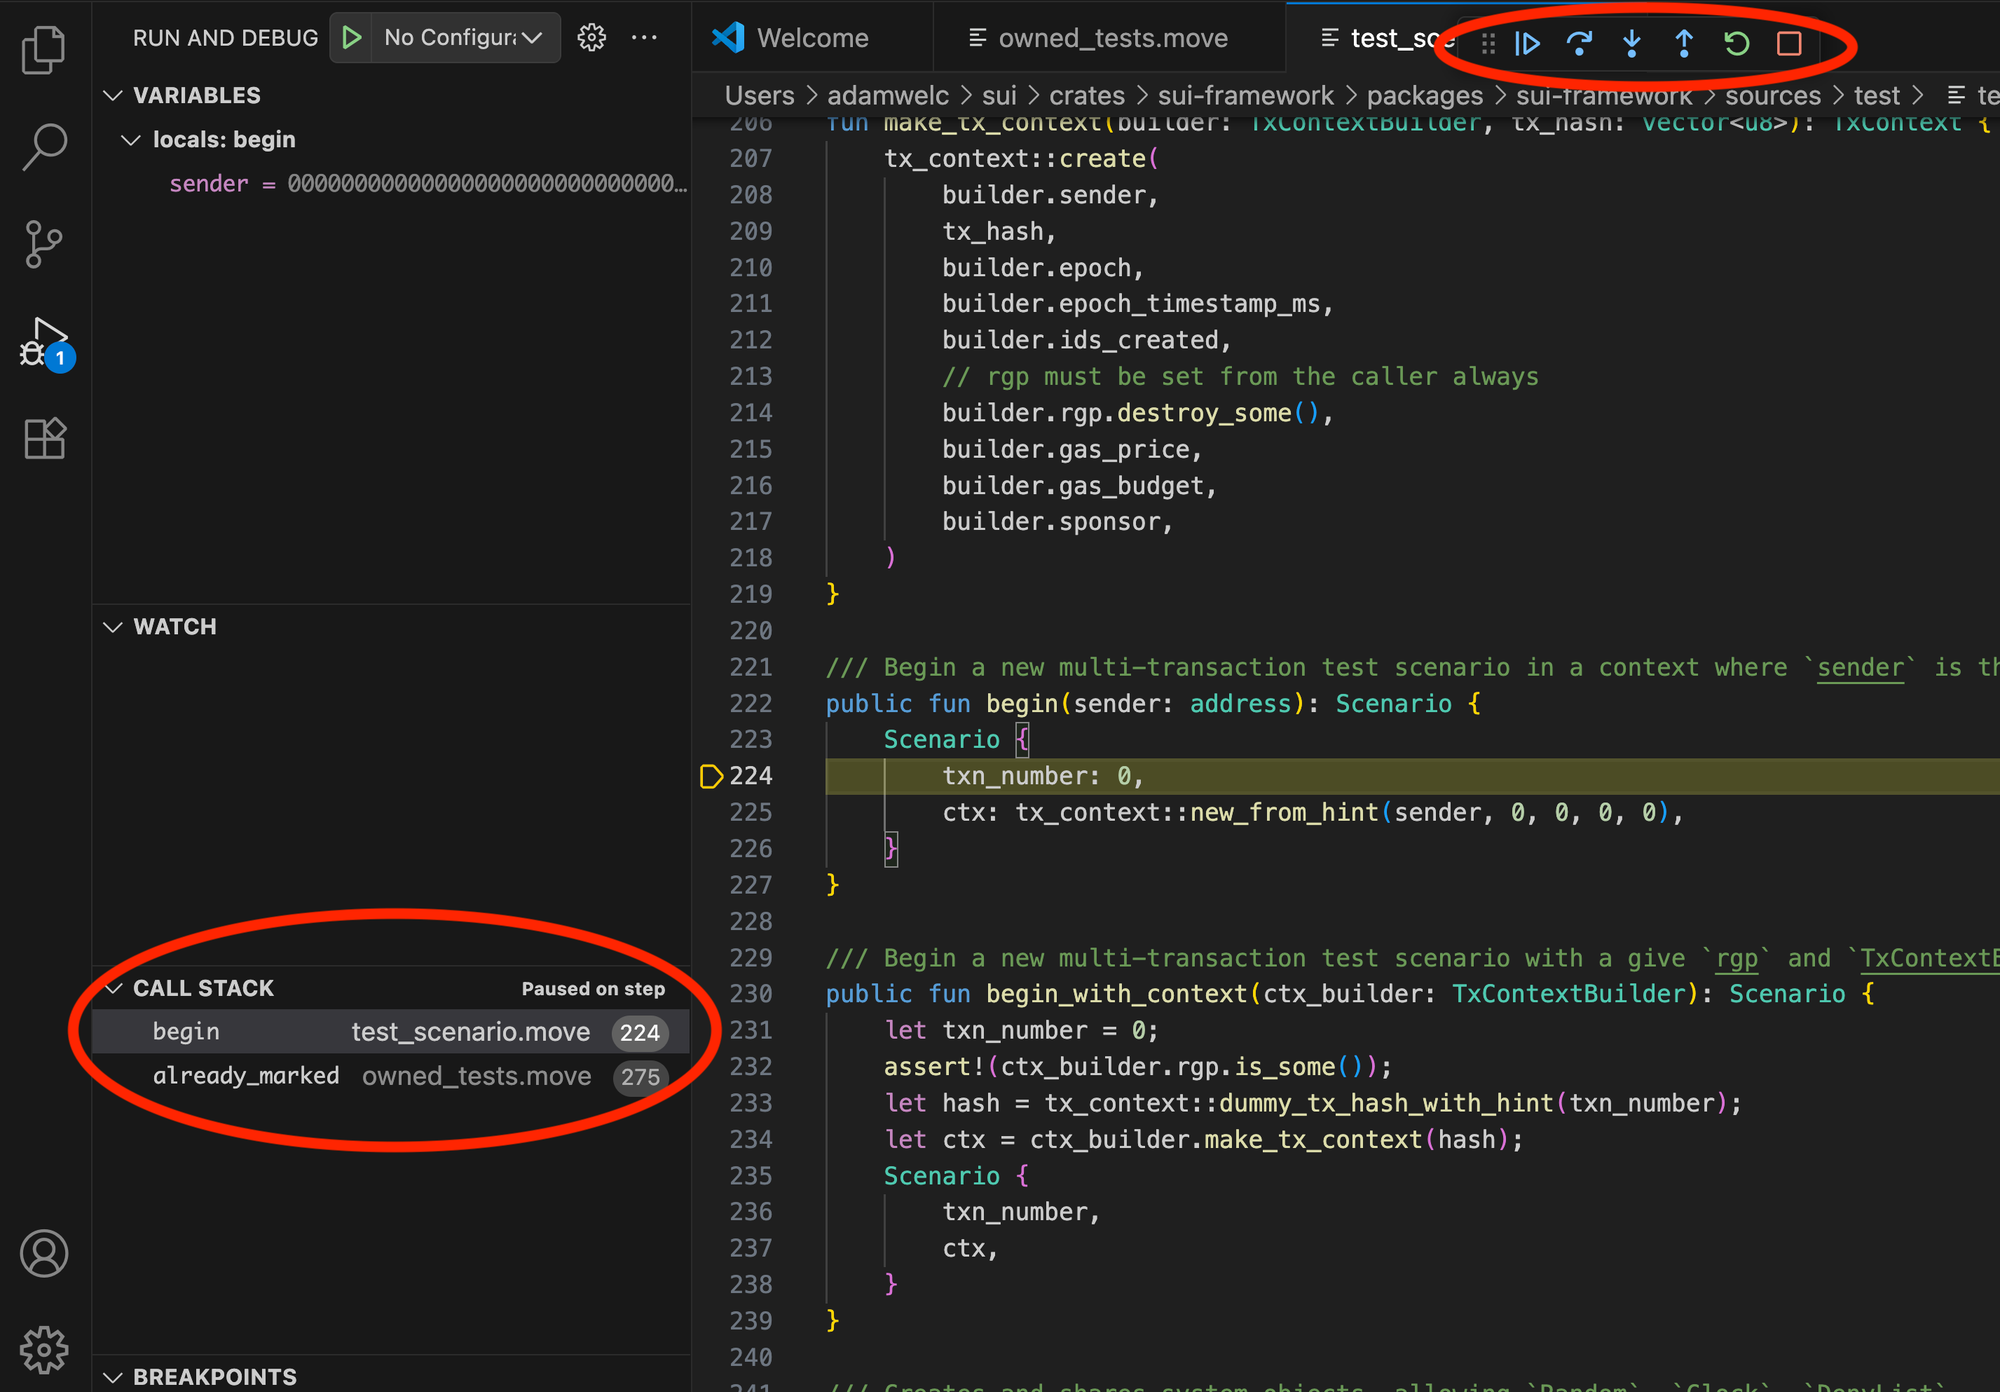
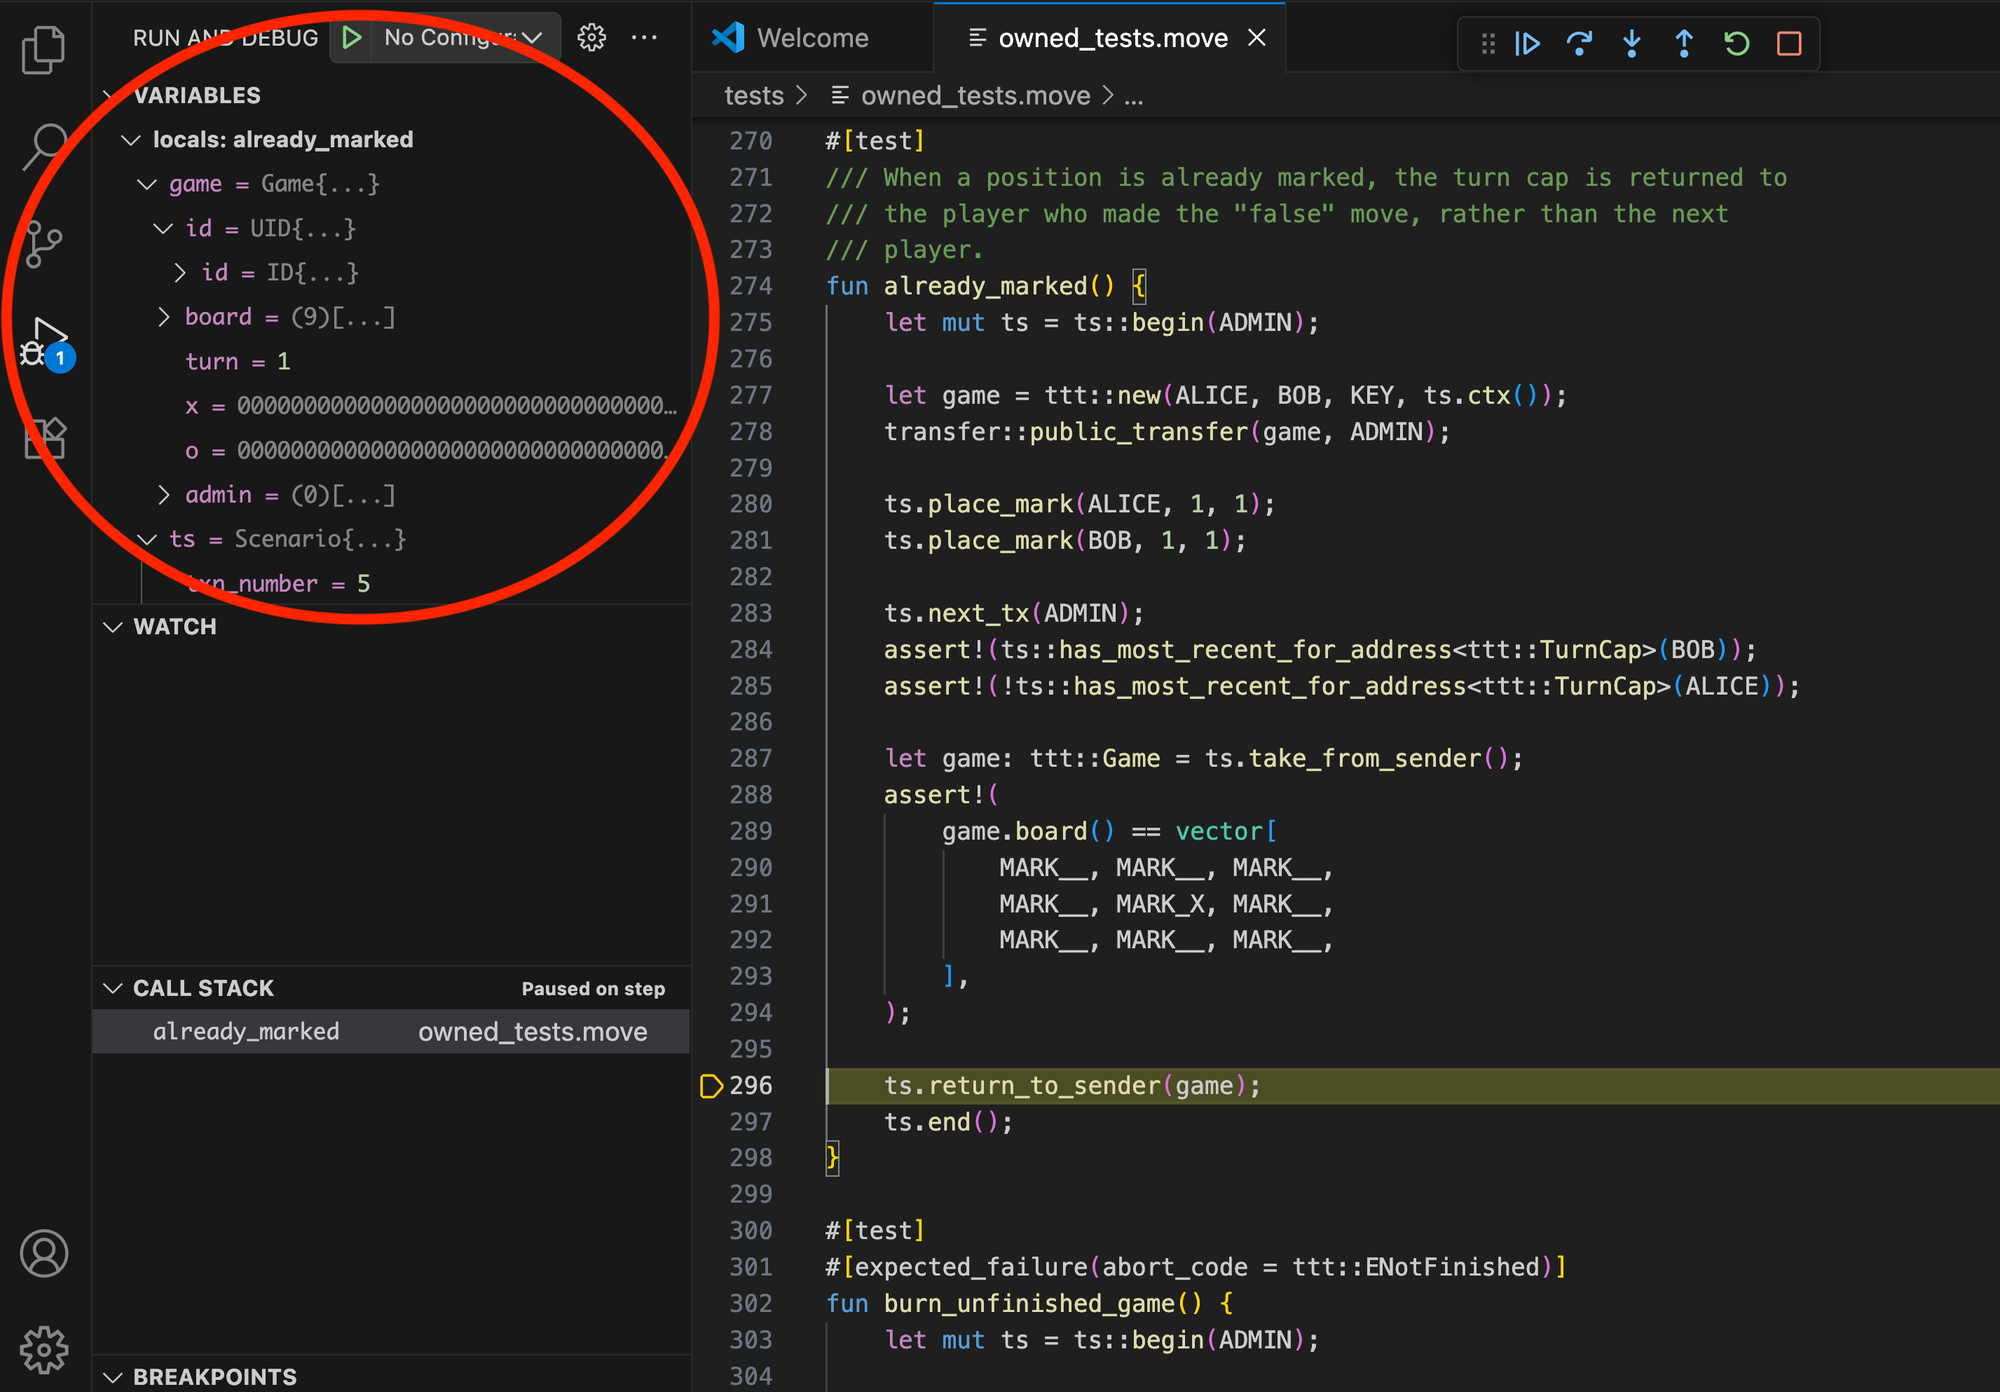
While replay shows what happened, debugging explains why. Once a transaction has been reconstructed, the debugger allows developers to step through execution and observe how state evolves at each stage. This makes it possible to isolate the exact moment logic diverged from expectations and gain a clear understanding of how code behaved in practice.
The VSCode Move Trace Debugger extension enables debugging through a familiar, intuitive interface. In addition to debugging replayed onchain transactions, it also supports debugging Move unit tests.
The following features are supported:
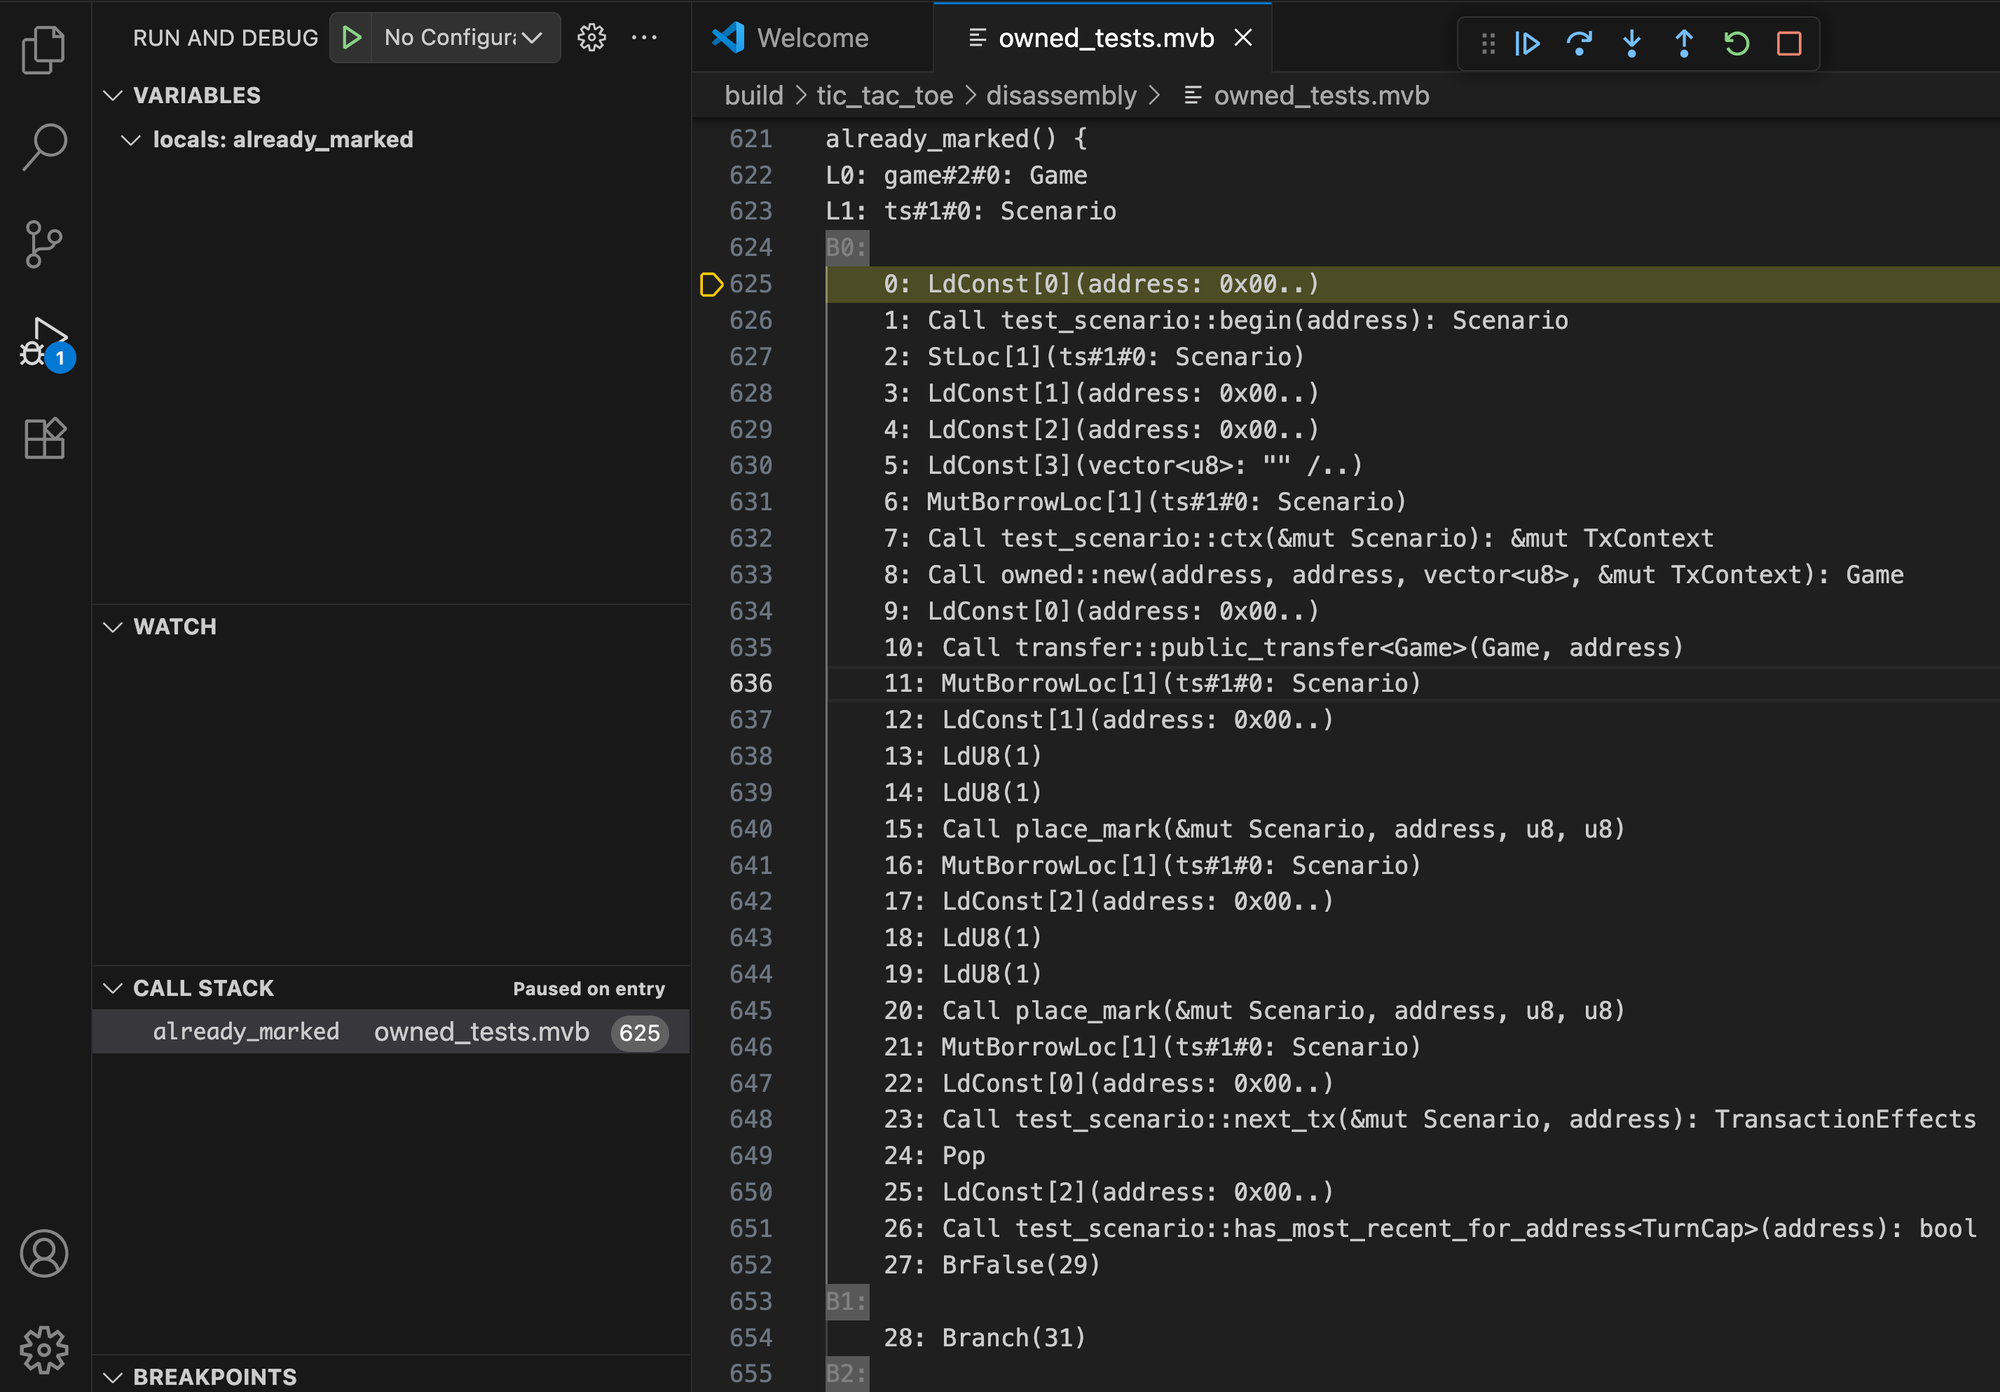
Disassembly and source-level debugging
When debugging an onchain transaction, the source code for Move calls executed within the transaction is not available by default, as it is not stored onchain. A debug session will start in the disassembly view where Move code is represented by disassembled bytecode.
When debugging an onchain transaction, the source code for Move calls executed within the transaction is not available by default, as it is not stored onchain. A debug session will start in the disassembly view where Move code is represented by disassembled bytecode.
This is a lower-level representation of the Move code that is still quite useful to improve one's understanding of the Move code behavior and execution flow. It also has one advantage over the source view: it is a much better match to what is recorded in the execution trace. In the presence of Move compiler optimizations, disassembly view is the ultimate source of truth. For example, some variables present in the source may no longer be present in the trace, which you can verify in the disassembly view. Source view can still be enabled by providing source code for onchain transactions manually.
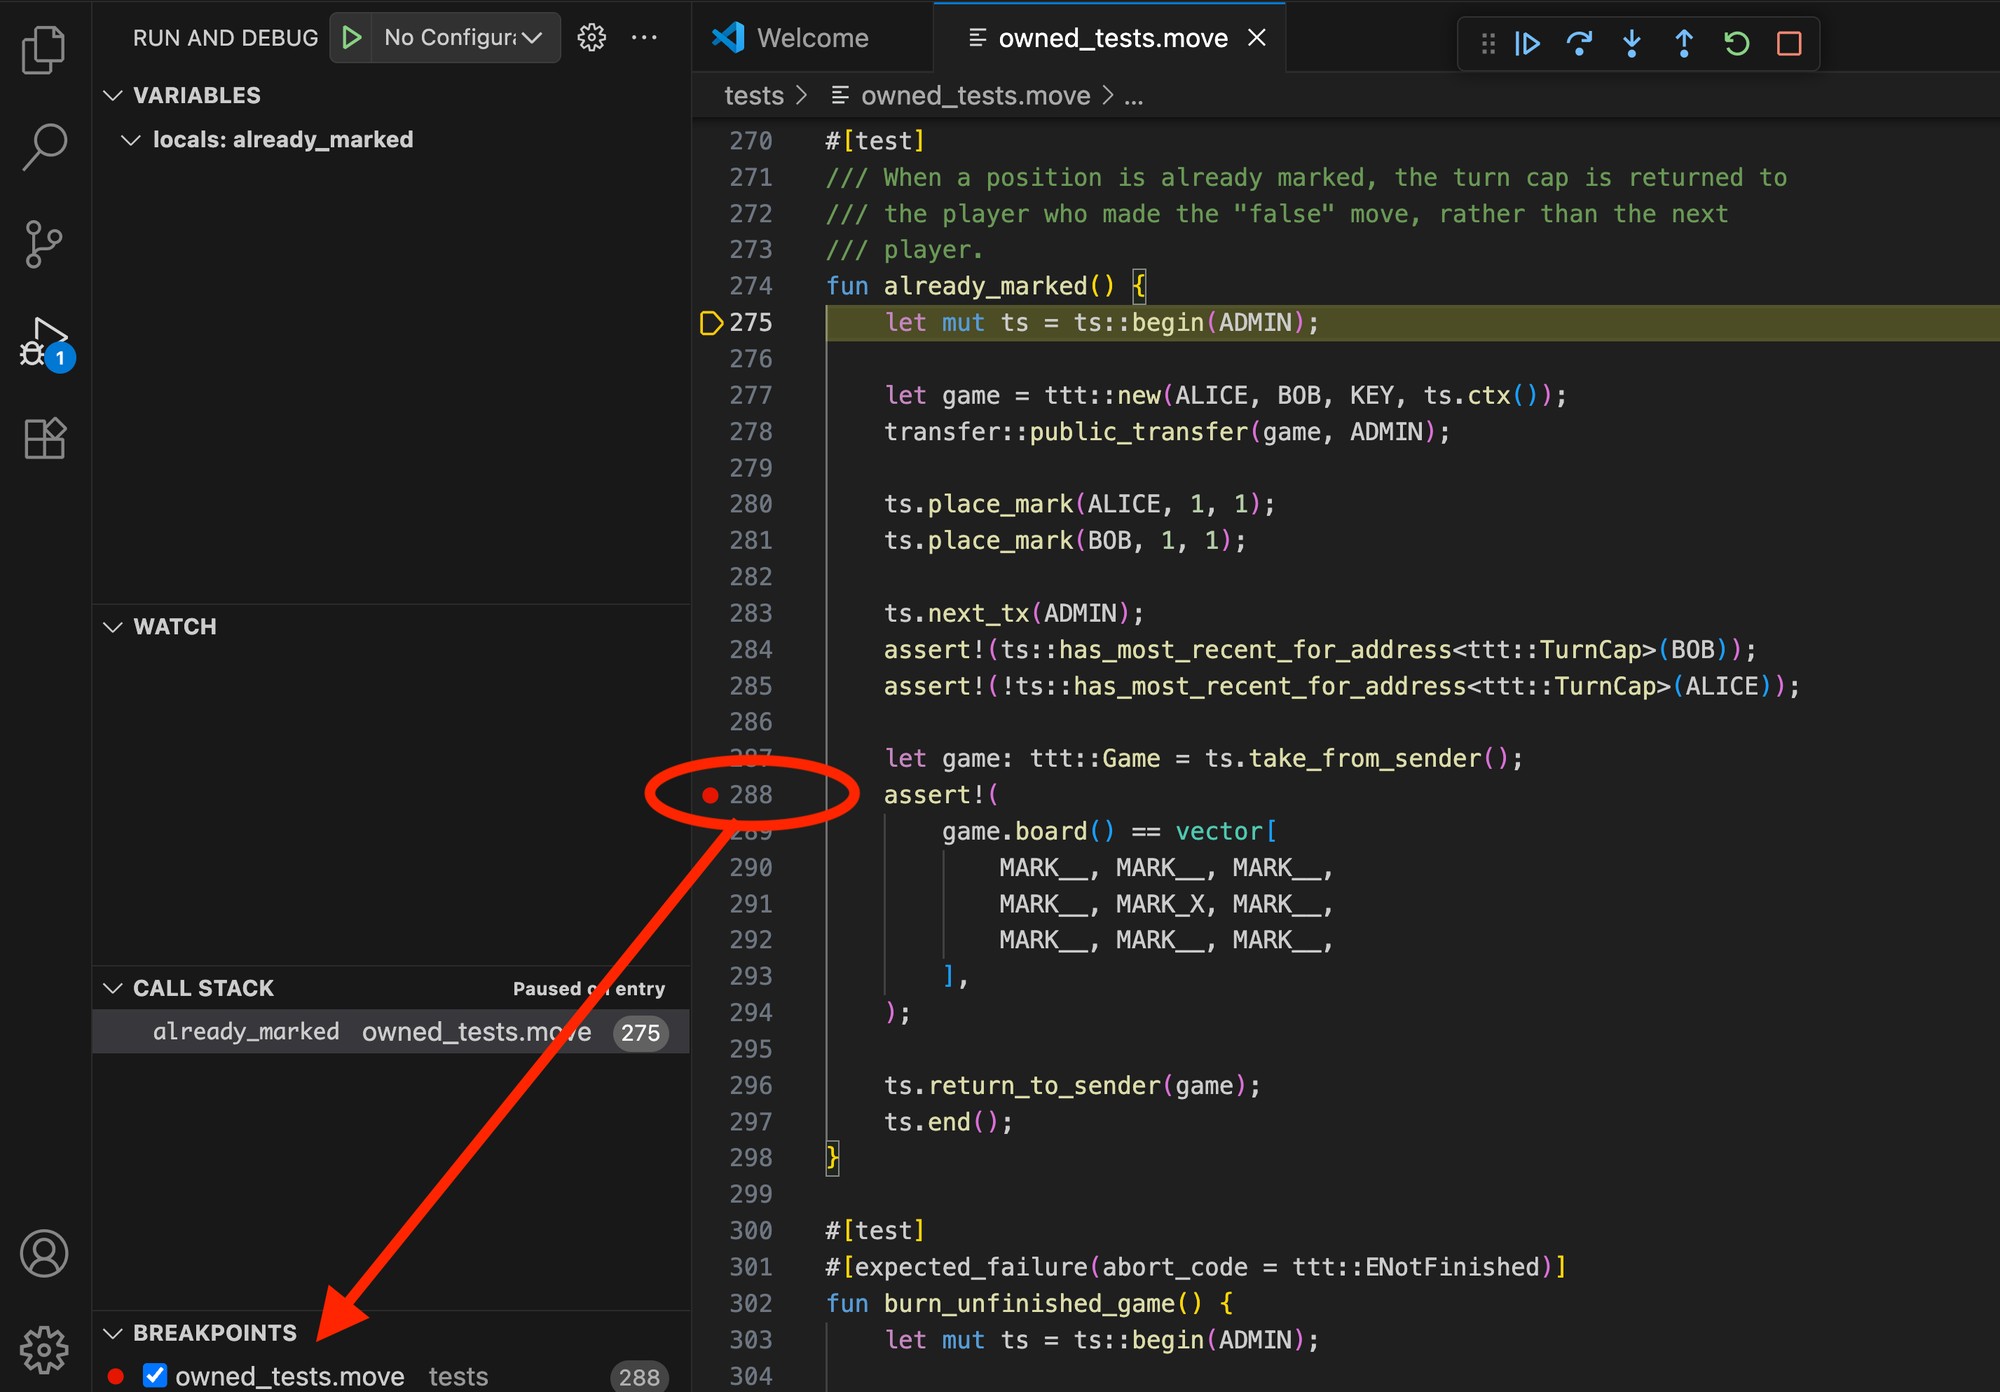
Stepping through code execution
Move Trace Debugger supports the following standard debug actions:
- Step Over
- Step Into
- Step Out
- Continue
- Restart
- Stop
When stepping through the code into other function calls, the resulting call stack view in the left-hand side bar will update.
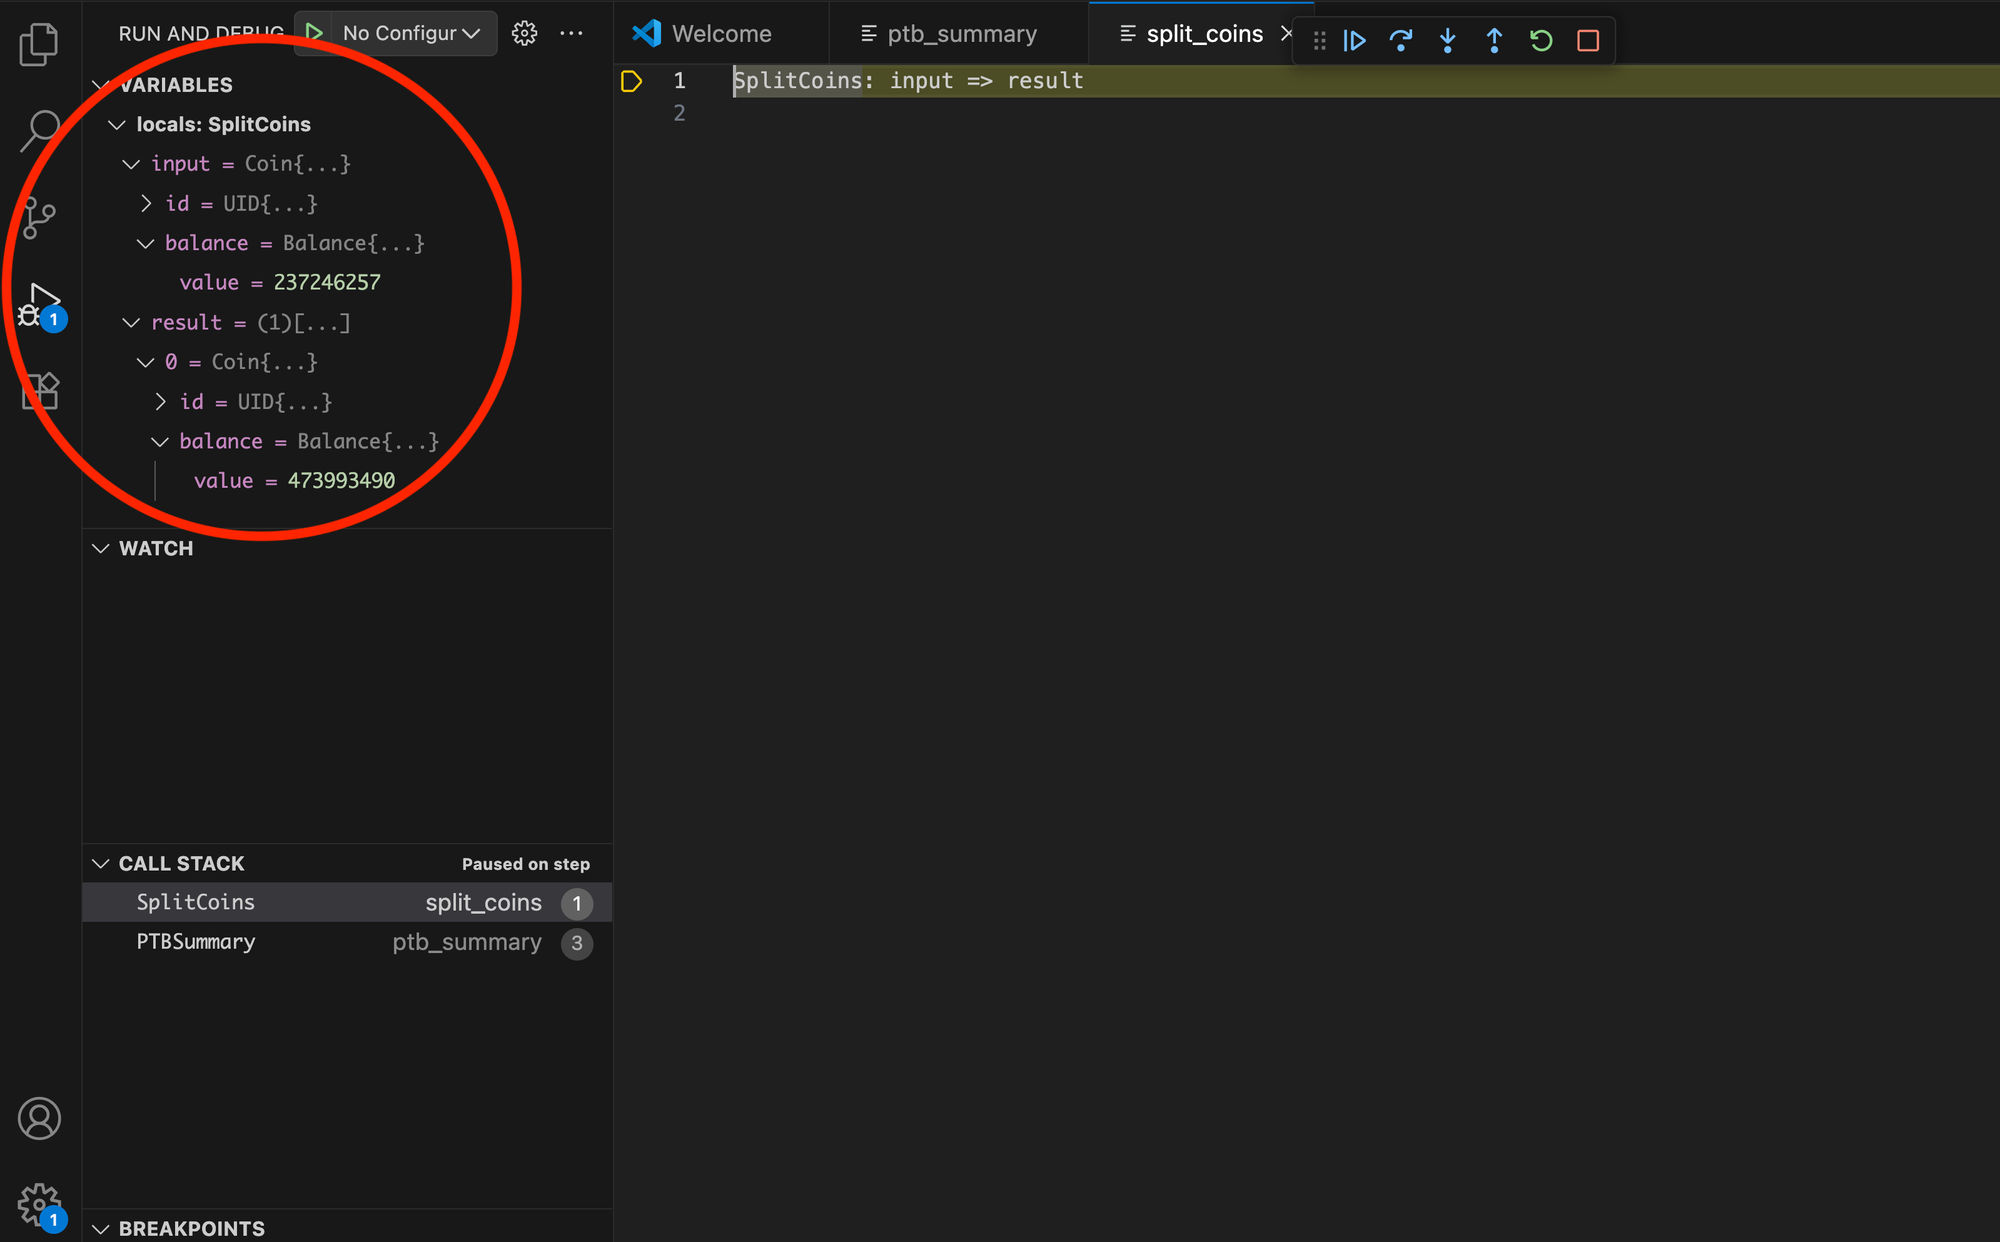
Tracking variable values
Move Trace Debugger supports displaying values of primitive types, Move structs, and references.
Line breakpoints
Move Trace Debugger supports line breakpoints.
PTB Debugging
When debugging PTBs, the debugger first displays a summary of the PTB structure, including Move calls and native PTB commands, such as SplitCoins, MergeCoins, and TransferObjects.
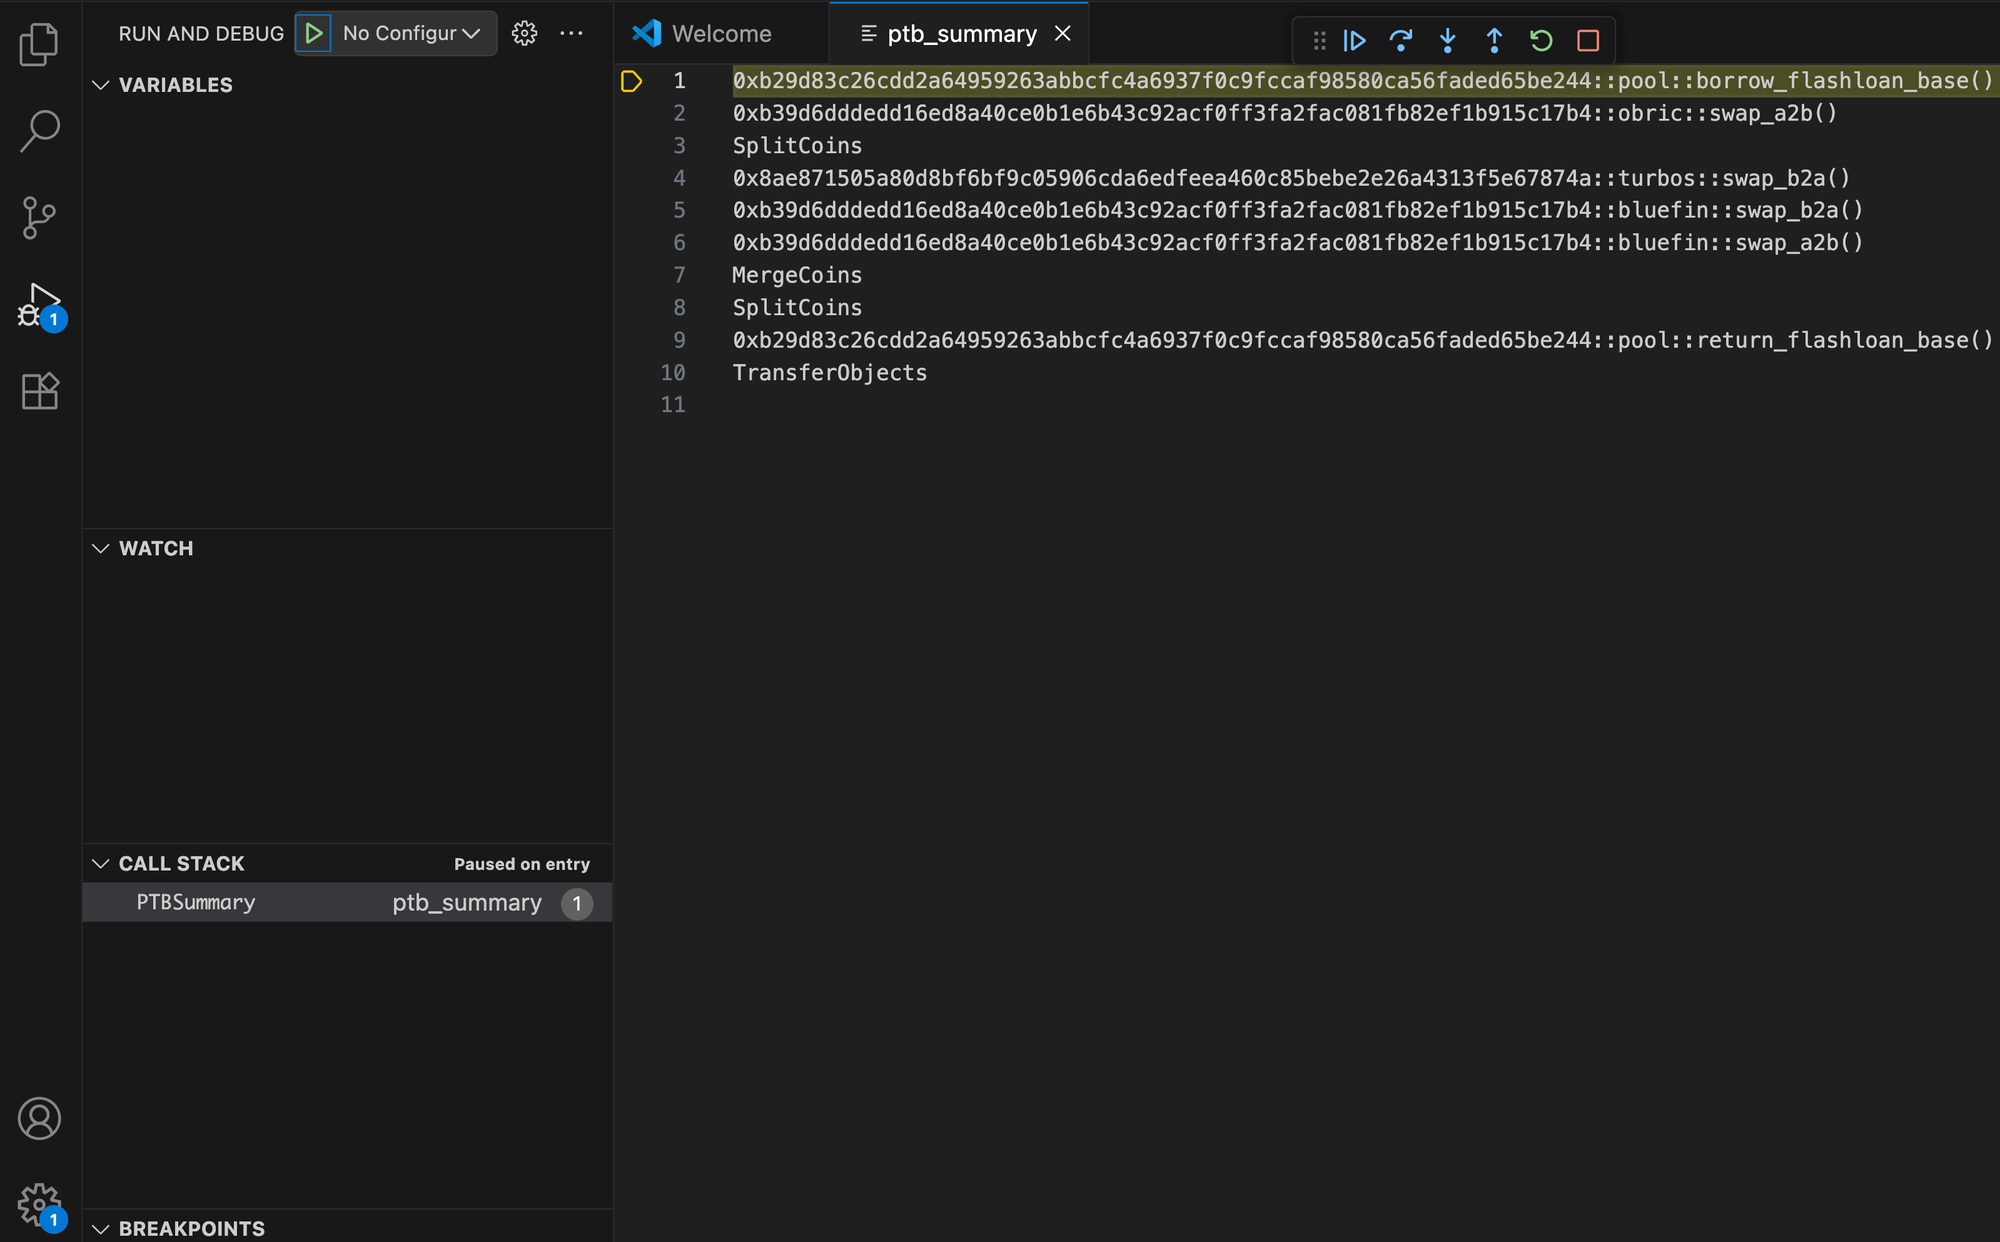
Stepping into a Move function starts Move code debugging with all the relevant features available, such as value tracking and breakpoints. Stepping into a native command allows you to inspect its input and result values.
The broader impact
Together, replay and debugging form a powerful feedback loop. Replay grounds analysis in actual history, while debugging uncovers the reasoning behind outcomes. Developers no longer need to redeploy contracts or rely on approximations, they can examine the exact transaction that caused an issue until they fully understand it.
These tools aren’t just conveniences for developers, they help shape the reliability of the entire ecosystem. For builders, they eliminate guesswork, reduce time spent on diagnostics, and increase confidence in shipping code. For users, it means an ecosystem that feels more reliable, responsive, and trustworthy.
By equipping developers with the ability to replay and debug real transactions, Sui strengthens the foundation of trust that every interaction depends on. Reliability at the builder level translates directly into smoother, safer experiences across the network.
By investing in tools like these, Sui continues to raise the baseline for what building and using Web3 apps can look like.